Analysis Of Variance (ANOVA): What It Is And How It Is Used In Statistics
In statistics, when the means of two or more samples are compared in relation to some variable of interest (for example, anxiety after psychological treatment), tests are used to determine whether or not there are significant differences between the means.
One of them is Analysis of Variance (ANOVA) In this article we will learn what this parametric test consists of and what assumptions must be met to be able to use it.
In statistics, we find the concept of analysis of variance (ANOVA), which consists of a grouping of statistical models and their associated procedures, where the variance is partitioned into certain components , due to diverse explanatory variables. If we break down its acronym in English, ANOVA stands for: ANalysis Of VAriance.
Analysis of Variance (ANOVA) is a type of parametric test This means that a series of assumptions must be met to apply it, and that the level of the variable of interest must be, at a minimum, quantitative (that is, at least an interval, for example the IQ, where there is a relative 0). .
Variance analysis techniques
The first analysis of variance techniques were developed in the 1920s and 1930s by RA Fisher, a statistician and geneticist. That is why the analysis of variance (ANOVA) It is also known as “Fisher’s Anova” or “Fisher’s analysis of variance.” ; this is also due to the use of the Fisher F distribution (a probability distribution) as part of the hypothesis test.
Analysis of variance (ANOVA) arises from the concepts of linear regression Linear regression, in statistics, is a mathematical model that is used to approximate the dependence relationship between a dependent variable Y (for example anxiety), the independent variables Xi (for example different treatments) and a random term.
Function of this parametric test
Thus, an analysis of variance (ANOVA) serves to determine whether different treatments (for example, psychological treatments) show significant differences or if, on the contrary, it can be established that their population means do not differ (they are practically the same, or their difference is not significant).
That is, ANOVA is used to test hypotheses about differences in means (always more than two). ANOVA involves an analysis or decomposition of the total variability; This, in turn, can be attributed mainly to two sources of variation:
Types of ANOVA
There are two types of analysis of variance (ANOVA) :
1. Anova I
When there is only one classification criterion (independent variable; for example, type of therapeutic technique). In turn, it can be intergroup (there are several experimental groups) and intragroup (there is a single experimental group).
2. Anova II
In this case, there is more than one classification criterion (independent variable). As in the previous case, this can be intergroup and intragroup.
Characteristics and assumptions
When analysis of variance (ANOVA) is applied in experimental studies, each group consists of a certain number of subjects, and it is possible that the groups differ in terms of this number. When the number of subjects coincides, we speak of a balanced or balanced model
In statistics, in order to apply the analysis of variance (ANOVA), a series of assumptions must be met:
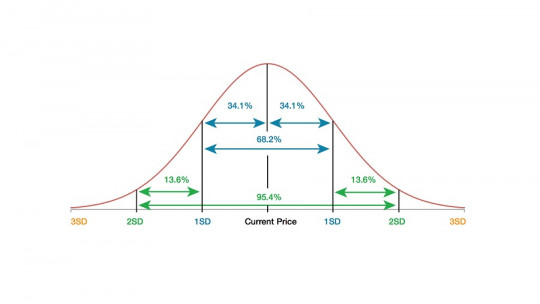
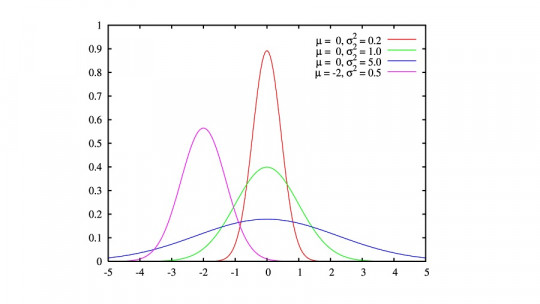
1. Normality
This means that the scores on the dependent variable (for example anxiety) must follow a normal distribution. This assumption It is verified by means of so-called goodness-of-fit tests
2. Independence
It implies that there is no autocorrelation between the scores, that is, the existence of independence of the scores from each other. To ensure compliance with this assumption, we will have to carry out a MAS (simple random sampling) to select the sample that we are going to study or work on.
3. Homoscedasticity
That term means “equality of variances of subpopulations” Variance is a statistic of variability and dispersion, and increases the greater the variability or dispersion of the scores.
The assumption of homoscedasticity is verified using Levene’s Test or Bartlett’s Test. If this is not met, another alternative is to perform a logarithmic transformation of the scores.
Other assumptions
The above assumptions must be met when using intergroup analysis of variance (ANOVA). However, when using a within-group ANOVA, the above assumptions and two more must be met:
1. Sphericity
If it is not met, it would indicate that the different sources of error correlate with each other A possible solution if this happens is to perform a MANOVA (Multivariate Analysis of Variance).
2. Additivity
It assumes no subject x treatment interaction; If it is not met, the error variance would increase.