Normal Distribution: What It Is, Characteristics And Examples In Statistics
In statistics and probability, the normal distribution, also called Gaussian distribution (after Carl F. Gauss), Gaussian distribution or Laplace-Gauss distribution, reflects how data are distributed in a population.
This is the most common distribution in statistics, and is considered the most important due to the large number of real variables that take its form. Thus, many of the characteristics in the population are distributed according to a normal distribution: intelligence, anthropometric data in human beings (for example height, size…), etc.
Let’s see in more detail what the normal distribution is, and several examples of it.
The normal distribution is a concept belonging to statistics. Statistics is the science that deals with the counting, ordering and classification of data obtained from observations, in order to make comparisons and draw conclusions.
A distribution describes how certain characteristics (or data) are distributed in a population The normal distribution is the most important continuous model in statistics, both for its direct application (since many variables of general interest can be described by said model), and for its properties, which have allowed the development of numerous statistical inference techniques.
The normal distribution is, therefore, about a probability distribution of a continuous variable Continuous variables are those that can take on any value within an interval that is already predetermined. Between two of the values, there can always be another intermediate value, which can be taken as a value by the continuous variable. An example of a continuous variable is weight.
Historically, the name “Normal” comes from the fact that for a time it was believed, by doctors and biologists, that all natural variables of interest followed this model.
Characteristics
Some of the most representative characteristics of the normal distribution are the following:
1. Mean and standard deviation
to the normal distribution corresponds to a mean of zero and a typical or standard deviation of 1 The typical or standard deviation indicates the separation that exists between any value in the sample and the mean.
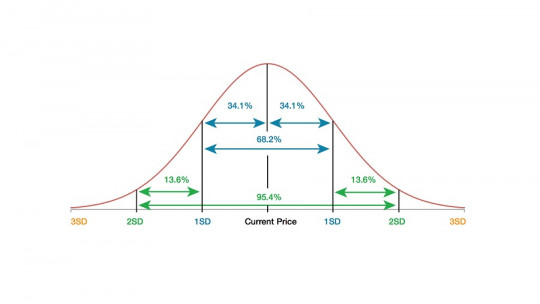
2. Percentages
In a normal distribution, can determine exactly what percentage of the values will be within any range specific. For example:
About 95% of the observations are within 2 standard deviations of the mean. 95% of the values will be located within 1.96 standard deviations with respect to the mean (between −1.96 and +1.96).
About 68% of the observations are within 1 standard deviation of the mean (-1 to +1), and about 99.7% of the observations would be within 3 standard deviations of the mean (-3 to +3 ).
Examples of Gaussian distribution
Let’s give three examples to illustrate, for practical purposes, what the normal distribution is.
1. Height
Let’s think about the height of all Spanish women; This height follows a normal distribution. That is, the height of most women will be close to average height. In this case, the average Spanish height is 163 centimeters for women.
On the other hand, a similar number of women will be a little taller and a little shorter than 163cm ; only a few will be much higher or much lower.
In the case of intelligence, the normal distribution is fulfilled worldwide, for all societies and cultures. This implies that most of the population has average intelligence and that at the extremes (below, people with intellectual disabilities, and above, gifted), there is a smaller part of the population (approximately the same % below as above).
3. Maxwell curve
Another example that illustrates the normal distribution is the Maxwell curve. Maxwell’s curve Within the field of physics, it indicates how many gas particles move at a given speed
This curve rises smoothly from low speeds, peaks at average, and falls gently again toward high speeds. Thus, this distribution shows that the majority of the particles move at a speed around the average, a characteristic characteristic of the normal distribution (concentrating most of the cases in the average).